
Have you ever wondered why some websites consistently appear at the top of Google’s search results while others get buried on page five? Or been curious about how to accurately track your website traffic without relying on guesswork? If these questions sound familiar, you’re about to discover a powerful tool that can transform your digital strategy.
Google Search Console (GSC) is a free, user-friendly platform that offers invaluable insights into how your website performs in search results. Unlike many complex SEO tools, GSC provides direct access to Google’s own data about your site’s visibility and performance.
In this comprehensive guide, we’ll break down the essential features of Google Search Console and show you how to leverage this powerful tool to boost your site’s visibility. We’ll explore the differences between GSC and Google Analytics, walk you through setting up your account, and dive deep into the critical Index Coverage and Performance reports with technical specifics that can help diagnose and resolve common issues.
By the time you finish reading, you’ll have the knowledge to identify crawling errors, track your search rankings, and make data-driven decisions to improve your online presence. Ready to unlock the full potential of your website? Let’s dive in.
Understanding the Role of Google Search Console (GSC)
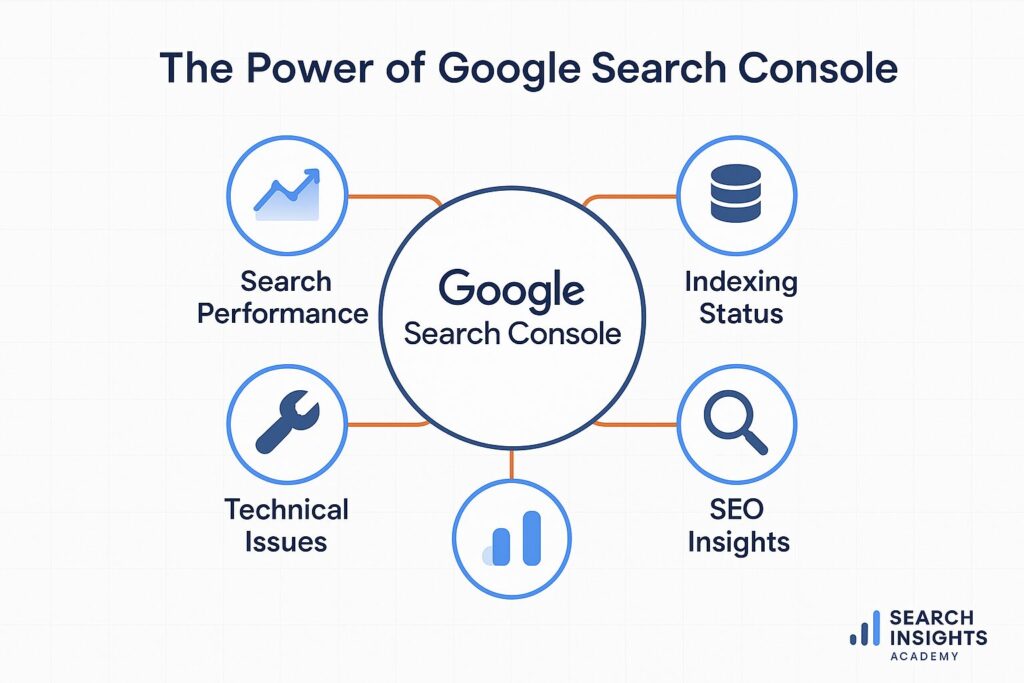
Google Search Console is much more than just another analytics tool – it’s your direct line of communication with Google’s indexing systems and search algorithms.
Why GSC Matters for Businesses Worldwide
Whether you run a small local bakery in Melbourne, a tech startup in San Francisco, or an e-commerce store serving customers globally, GSC helps you understand how users find you through Google. According to Search Engine Journal, 68% of all online experiences begin with a search engine, making GSC an essential tool for businesses of all sizes.
The platform shows you which queries bring users to your site, how often your pages appear in search results (impressions), and how frequently users click through to your content. These insights allow you to tailor your strategy to regional demands and global trends.
From a technical standpoint, GSC is unique because it provides the only direct insights into how Google’s crawlers interact with your site – information you simply cannot get from third-party tools.
Differentiating Google Search Console from Google Analytics
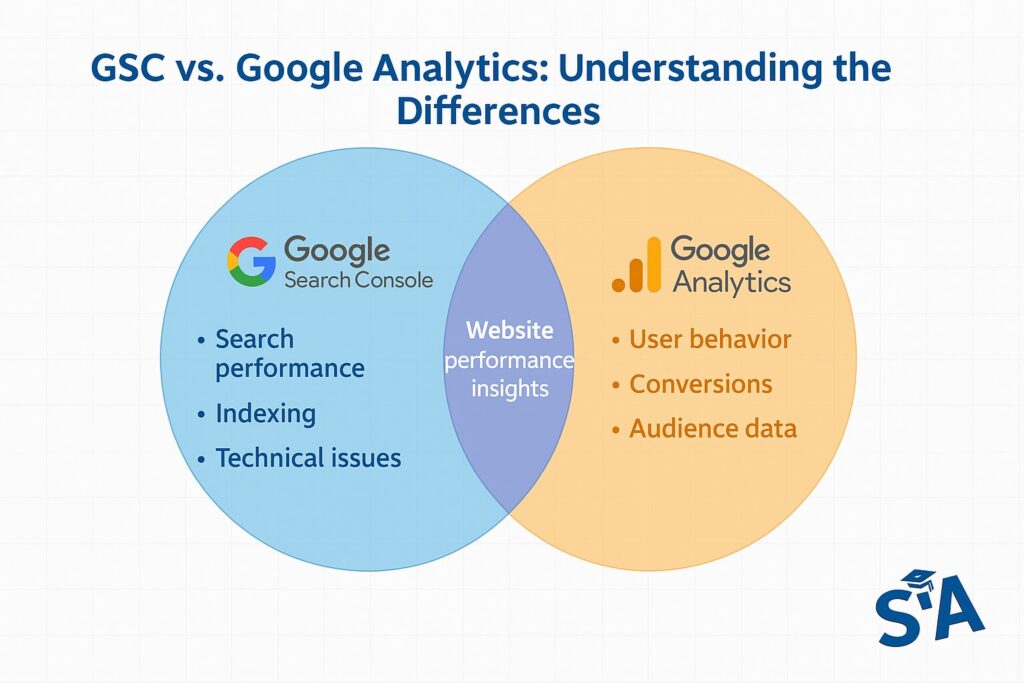
Many website owners mistakenly view Google Analytics and GSC as interchangeable tools. In reality, they serve complementary but distinct purposes. As Moz explains, Google Analytics focuses on what happens once users land on your site – tracking page views, sessions, bounce rates, and user behavior.
GSC, on the other hand, reveals what happens before the click – showing you how your site appears in search results and which queries trigger your listings. From a data architecture perspective, Analytics measures user interactions, while GSC provides crawling, indexing, and search visibility data.
At a technical level, the key differences include:
- Data collection method: Analytics requires JavaScript tracking code on your pages, while GSC works through direct integration with Google’s search infrastructure
- Data retention: Analytics has time-limited data retention (14-50 months depending on settings), while GSC retains 16 months of performance data
- Attribution modeling: Analytics allows custom attribution models, while GSC attributes clicks solely to the last search query
- API access: Both offer APIs, but they expose entirely different data sets about your site
Both platforms work best when used together, creating a complete picture of your digital presence from search to conversion.
Getting Started
If you’re new to Google Search Console, getting started might seem intimidating. Don’t worry – the setup process is straightforward, and the payoff is immense.
What Is Google Search Console in SEO?
At its core, GSC is your command center for monitoring and optimizing how your site performs in Google’s search results. According to Google’s own documentation, the platform helps you:
- Confirm that Google can find and crawl your website
- Fix indexing problems and submit new or updated content
- Monitor your site’s search performance
- Receive alerts when Google detects issues on your site
- See which sites link to your content
- Troubleshoot mobile usability issues
For SEO professionals and website owners alike, GSC provides direct insights into how Google perceives your site – information you simply can’t get anywhere else.
How to Set Up Google Search Console
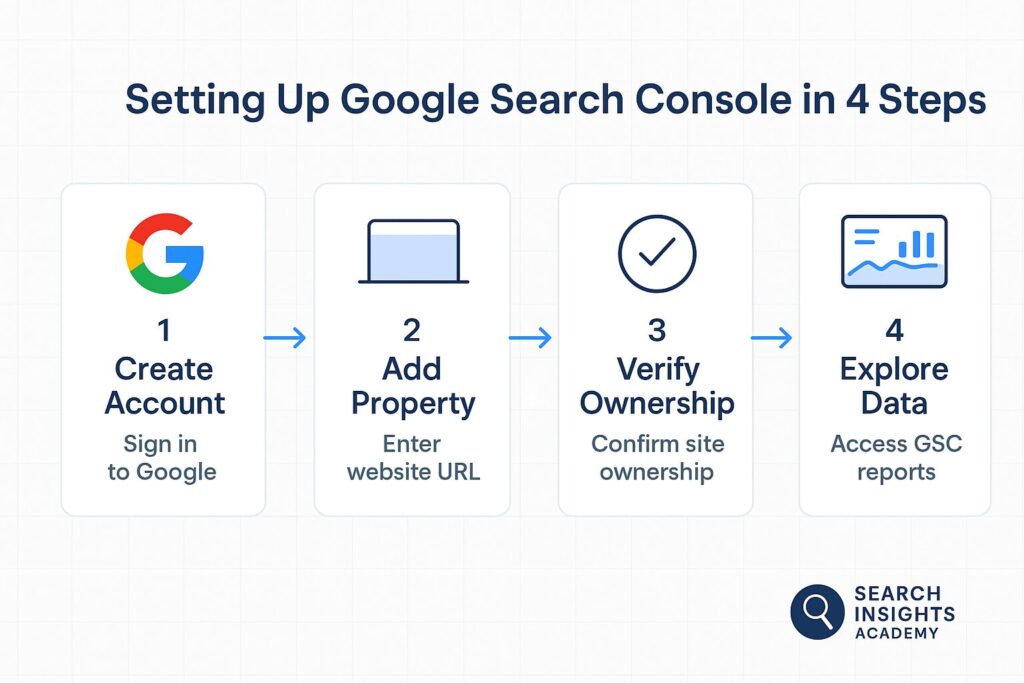
Setting up Google Search Console is surprisingly simple but requires technical verification. Start by visiting the official Google Search Console website and signing in with your Google account.
Once logged in, you’ll need to add your website as a property. Google offers two verification methods:
- Domain property: Verifies all subdomains and URL prefixes (recommended)
- URL prefix property: Verifies a specific URL version of your site
For most websites, the domain property option provides the most comprehensive data. After selecting your property type, you’ll need to verify ownership through one of several methods:
- HTML file upload: Download a specific HTML file and upload it to your web server’s root directory
- HTML tag: Add a
<meta>tag to your site’s<head>section - DNS TXT record: Add a specific TXT record to your domain’s DNS configuration
- Google Analytics tracking code: Use your existing GA property for verification
- Google Tag Manager container: Verify through an existing GTM container
For domain properties, DNS verification is required, which typically looks like:
NAME: @
TYPE: TXT
TTL: 3600
VALUE: google-site-verification=1a2b3c4d5e6f7g8h9i0j
The Search Engine Journal guide to verification walks through these methods in detail.
Google Console Login: Verifying Your Site
Once you’ve verified ownership, you can access your GSC dashboard by simply visiting search.google.com/search-console and logging in with your Google account.
If you manage multiple websites, you’ll see all your verified properties listed on the dashboard. Simply select the site you want to analyze, and you’ll have immediate access to crucial data including:
- Performance metrics like clicks and impressions
- Indexing status and potential crawling issues
- Mobile usability reports
- Enhancement opportunities for structured data and more
From a technical perspective, GSC uses the concept of “property sets” which allow you to group multiple properties together for consolidated reporting. This is particularly useful for sites with multiple subdomains or international versions.
Common Mistakes When First Using GSC
Many newcomers to Search Console make preventable errors that limit the effectiveness of the tool. According to SEMrush research, common pitfalls include:
- Not verifying all HTTP/HTTPS and www/non-www variations: Each version counts as a separate property in GSC’s architecture
- Ignoring the
robots.txtfile: GSC will show warnings if your robots.txt blocks important resources - Missing XML sitemap submission: Your sitemap should follow the protocol at sitemaps.org and include all canonical URLs
- Overlooking crawl rate settings: Advanced users can adjust how frequently Googlebot crawls your site via the Settings > Crawl Stats section
- Not configuring international targeting correctly: If you have region-specific content, the International Targeting report helps specify which countries each version targets
By avoiding these mistakes, you’ll get the most accurate and actionable insights from GSC right from the start.
People Also Ask (PAA): Top Questions
Let’s address some of the most common questions about Google Search Console.
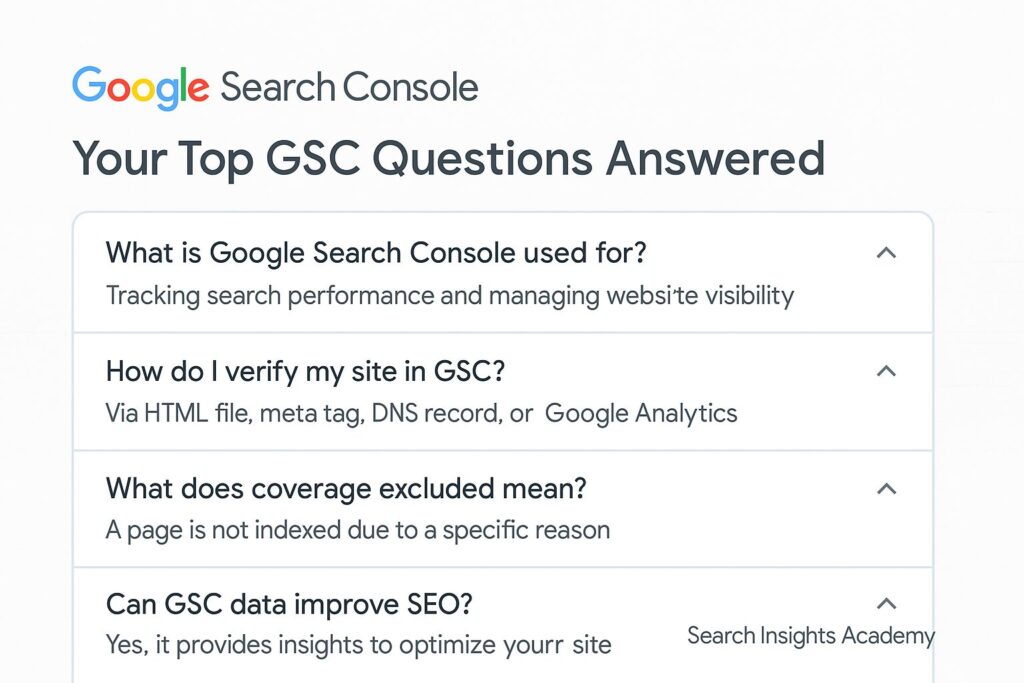
What Is Google Search Console?
Google Search Console is a free web service by Google that helps you monitor, maintain, and troubleshoot your site’s presence in Google Search results. Unlike paid SEO tools, GSC provides data directly from Google itself, including how often your site appears in search results, which queries trigger your listings, and whether technical issues are preventing Google from properly indexing your content.
At a technical level, GSC provides insights into:
- Crawl statistics: How often Googlebot visits your site and how much data it downloads
- Indexing status: Which of your pages are in Google’s index and why others might be excluded
- Search appearance: How your structured data, rich results, and AMP implementations appear in search
- Mobile usability: Technical issues that might affect your site’s performance on mobile devices
- Core Web Vitals: Loading, interactivity, and visual stability metrics that impact user experience
As Neil Patel explains, “Google Search Console is like having a direct line to Google. It shows you exactly how the search engine views your site and helps you fix issues that could hurt your rankings.”
How Do I Check Website Traffic with GSC?
While Google Search Console isn’t primarily a traffic analysis tool (that’s more Google Analytics’ territory), it does show you valuable data about how users find your site through search.
To check search traffic in GSC:
- Log in to your Search Console account
- Select your website property
- Click on “Performance” in the left sidebar
- View data on total clicks, impressions, average position, and click-through rate
For more advanced traffic analysis, you can:
- Apply filters: Use the filter function (+ button) to analyze data by query, page, country, device, search type, or date range
- Compare date ranges: Click the date selector to compare current performance against previous periods
- Export raw data: Use the export button to download CSV files for deeper analysis in spreadsheets or databases
- Access the API: For programmatic access, use the Search Console API (https://developers.google.com/webmaster-tools/search-console-api-original)
You can filter this data by specific countries, device types, or date ranges to get more focused insights. For example, you might discover that your site performs exceptionally well in certain regions or on mobile devices, as highlighted in Search Engine Land’s GSC guide.
How to Use Search Console for SEO?
GSC is a goldmine for SEO opportunities when you know where to look. According to Ahrefs’ guide on Search Console, here’s how to leverage GSC for SEO:
- Identify your highest-performing queries and pages in the Performance report to understand what’s already working
- Discover “near misses” – keywords where you rank on page two (positions 11-20) that could be optimized for quick wins
- Monitor your backlink profile to identify linking opportunities and potential toxic links
- Check Index Coverage to ensure Google can crawl and index your important pages
- Review Core Web Vitals to identify and fix page experience issues that could be hurting your rankings
- Submit new or updated content for faster indexing via URL Inspection
At a more technical level, you can also:
- Use regex filtering (e.g.,
query contains:product) to analyze groups of related keywords - Set up automated reporting via the GSC API or Google Data Studio
- Cross-reference GSC data with server logs to identify crawling inefficiencies
- Monitor JavaScript rendering issues through the URL Inspection tool’s rendered HTML view
- Track your site’s Core Web Vitals scores and prioritize pages that need improvement
By regularly reviewing these areas, you can systematically improve your site’s visibility in search results.
Is There a Difference Between GSC and Google Webmaster Tools?
If you’ve been in the digital marketing sphere for a while, you might remember Google Webmaster Tools (GWT). In 2015, Google rebranded this service as Google Search Console to make it more welcoming to all website owners, not just webmasters or technical users.
As Search Engine Journal reported, the change reflected Google’s recognition that everyone from business owners to marketers and SEO professionals uses the platform. While the name changed, the core purpose remained the same – helping website owners understand and improve how their sites appear in Google Search results.
From a technical perspective, the transition from GWT to GSC also included significant architecture changes and new features, including:
- Improved API capabilities with more endpoints and data
- More sophisticated reporting interfaces with filtering and comparison tools
- Enhanced mobile-specific reporting as mobile-first indexing became standard
- The addition of Core Web Vitals and page experience metrics
- Expanded structured data validation tools
Index Coverage Report Explained
One of GSC’s most valuable features is the Index Coverage report, which provides crucial insights into how Google crawls and indexes your site.
What Is Index Coverage and Why It Matters
For your pages to appear in search results, Google must first discover, crawl, and index them. The Index Coverage report shows you exactly which of your pages are in Google’s index and which ones are having problems.
According to Backlinko’s Brian Dean, “The Index Coverage report is like a health checkup for your website. It tells you if Google can access and understand your content, which is the first step toward ranking well.”
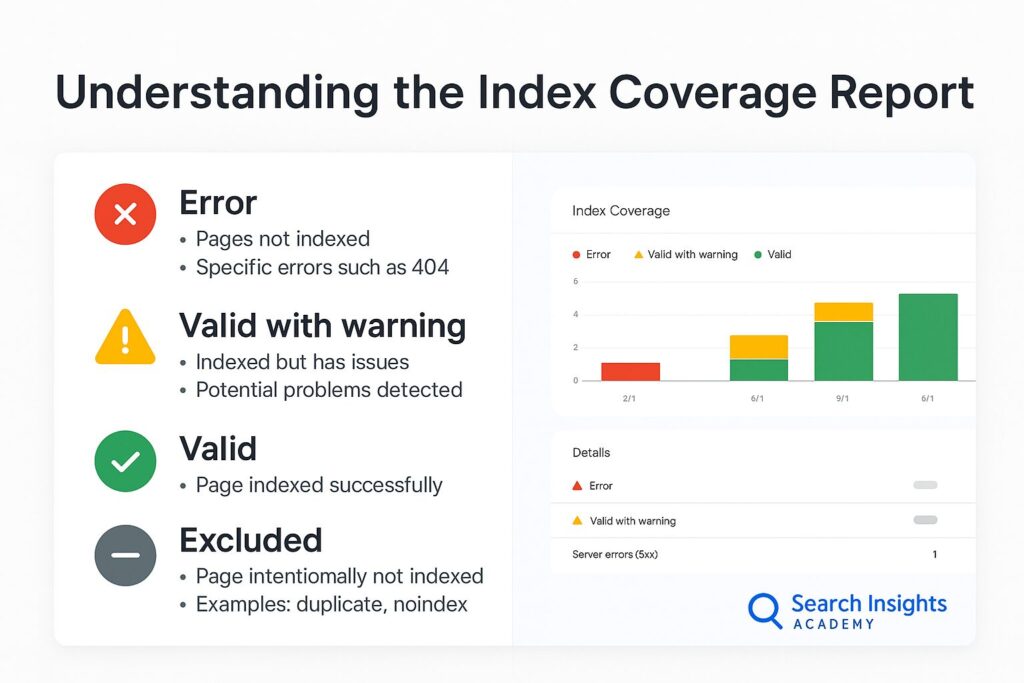
The report categorizes pages into four status types:
- Error: Pages that couldn’t be indexed due to significant issues
- Valid with warnings: Indexed pages that have potential problems
- Valid: Successfully indexed pages
- Excluded: Pages intentionally not indexed (often due to robots.txt directives or noindex tags)
From a technical SEO standpoint, the Index Coverage report is valuable because it reveals how Googlebot interacts with your site at the HTTP response level, showing status codes (200, 404, 500, etc.) and robots directives that affect indexing.
Monitoring this report helps ensure that all your important content is available to appear in search results.
Identifying Coverage Errors and Warnings
Coverage errors and warnings require immediate attention as they can significantly impact your search visibility. Common issues include:
- Server errors (5xx): Your server was unavailable when Google tried to crawl
- 404 errors: Pages that no longer exist but are still linked internally or externally
- Soft 404 errors: Pages that return a 200 status code but actually contain error content
- Crawl anomalies: Pages Google had trouble crawling for various technical reasons
- Submitted URL blocked by robots.txt: Pages submitted in your sitemap but blocked from crawling
At a technical level, these errors often stem from:
- Server configuration issues: Improper HTTP headers, misconfigured .htaccess files, or server timeout settings
- Robots directives conflicts: Contradictions between robots.txt, meta robots tags, and X-Robots-Tag HTTP headers
- Canonical tag problems: Incorrect implementation of rel=canonical tags creating circular references or orphaned pages
- Hreflang errors: Improper implementation of international targeting tags
- Render-blocking resources: JavaScript or CSS files that prevent proper rendering of page content
The Moz guide to fixing indexation problems offers detailed steps for addressing these common issues, helping you ensure Google can properly access and index your content.
How to Index Google: Submitting URLs and Sitemaps
When you publish new content or update existing pages, you want Google to discover and index them quickly. GSC offers two primary methods to expedite this process:
- URL Inspection Tool: This feature allows you to check if a specific URL is indexed and request indexing if it’s not. As Search Engine Journal notes, this is particularly useful for time-sensitive content.
- Sitemap Submission: Sitemaps help Google discover and understand the structure of your website. In GSC, you can submit your sitemap by navigating to “Sitemaps” in the left sidebar and entering the location of your sitemap file (typically yourdomain.com/sitemap.xml).
From a technical perspective, your sitemap should:
- Follow the XML sitemap protocol outlined at sitemaps.org
- Include the
<lastmod>tag with accurate timestamps in W3C format (YYYY-MM-DDThh:mm+TZ) - Stay under 50MB and 50,000 URLs per file (using sitemap index files for larger sites)
- Include only canonical URLs (not duplicates, redirects, or non-indexable pages)
- Use the appropriate
<priority>and<changefreq>attributes to guide crawling behavior
For dynamic websites, consider implementing automatic sitemap generation through plugins (for CMS platforms) or custom scripts that update your sitemap when content changes.
According to Google’s official documentation on sitemaps, “A sitemap is especially helpful if your site has dynamic content, pages that aren’t easily discovered by Google during a normal crawl, or if your site is new and has few external links to it.”
Fixing Index Coverage Issues Step by Step
When you encounter index coverage issues, follow this systematic approach to resolve them:
- Identify the problem: Review the specific error message and affected URLs in the Index Coverage report
- Diagnose the root cause: Use the URL Inspection tool to see how Google views the problematic page
- Implement a fix: Address the underlying issue, whether it’s a server configuration problem, content quality concern, or technical SEO issue
- Validate your fix: Once resolved, use the “Validate Fix” button in GSC to prompt Google to recrawl the affected URLs
For more technical issues, you might need to:
- Check server logs to identify specific HTTP response codes being returned
- Verify that your robots.txt file allows Googlebot access to necessary resources
- Ensure proper implementation of canonical tags to prevent duplicate content issues
- Use fetch and render in the URL Inspection tool to see if JavaScript content is properly processed
- Implement proper HTTP status codes (301 for redirects, 404 for not found, etc.)
For particularly stubborn issues, you can use tools like cURL or specialized crawlers to simulate Googlebot’s behavior:
curl -A "Mozilla/5.0 (compatible; Googlebot/2.1; +http://www.google.com/bot.html)" https://example.com/problem-pageFor persistent issues, Yoast’s troubleshooting guide offers in-depth solutions for common indexing problems, helping you ensure your content is properly represented in Google’s index.
Performance Reports in GSC
The Performance report is perhaps the most frequently accessed feature in Google Search Console, providing crucial data about how your site performs in search results.
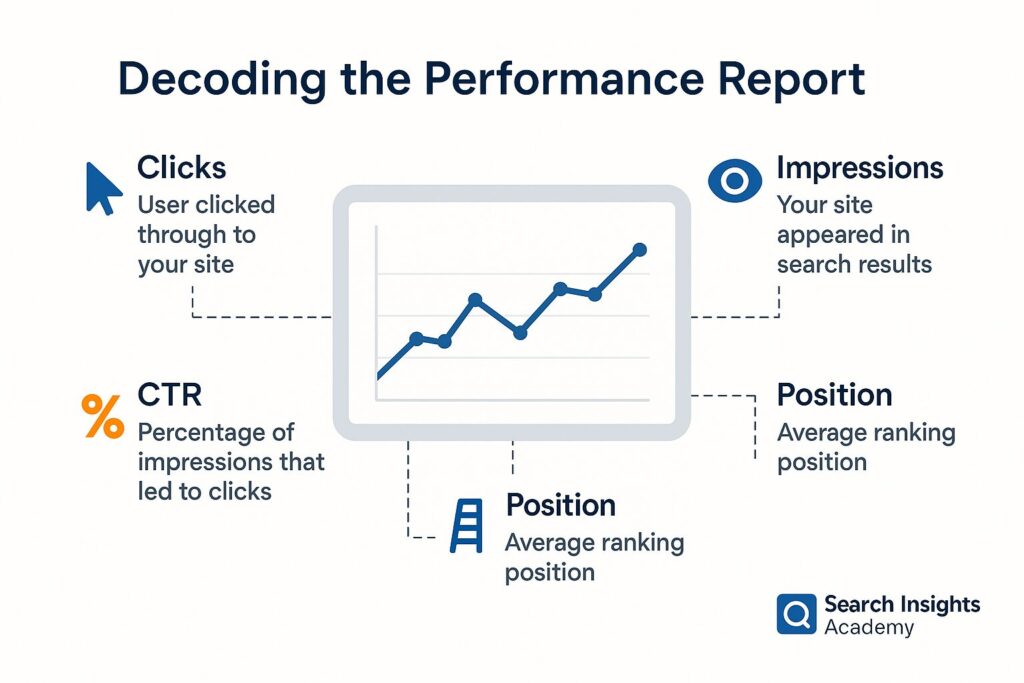
Interpreting Total Impressions in Google Search Console
Impressions represent how often your pages appear in search results, whether or not users click through to your site. This metric offers valuable insights into your content’s visibility and potential reach.
A high number of impressions with a low click-through rate might indicate that your titles and meta descriptions aren’t compelling enough, or that you’re ranking for queries that don’t align with your content. As Search Engine Land points out, analyzing impression data helps you identify opportunities to improve your search snippets and optimize for more relevant keywords.
From a technical perspective, it’s important to understand that GSC counts an impression whenever your site appears in the search results that a user views. This means:
- If you rank on page 2 but users only view page 1, no impression is counted
- If multiple pages from your site appear for one query, each gets counted as an impression
- Featured snippets and rich results count as impressions, but are not distinguished in the basic report
The impression data is sampled, particularly for sites with high search visibility, so small variations should not be over-interpreted.
Understanding Performance Results and Metrics
The Performance report displays four key metrics:
- Clicks: The number of times users clicked through to your site from search results
- Impressions: How often your pages appeared in search results
- Average CTR (Click-Through Rate): The percentage of impressions that resulted in clicks
- Average Position: Your average ranking position in search results
According to SEMrush’s research, these metrics provide complementary insights that help you understand not just how visible your content is, but how compelling it is to searchers.
From a technical standpoint, it’s important to understand how GSC calculates average position:
Average Position = Sum of all ranking positions / Number of impressionsThis means that if your page ranks #1 for one query (getting 100 impressions) and #10 for another query (getting 10 impressions), your average position would be:
(1*100 + 10*10) / (100 + 10) = 200/110 = 1.82This weighted average explains why your average position might change even when your rankings for individual queries remain the same – it’s affected by the distribution of impressions across different queries.
You can filter these metrics by query, page, country, device, and date range to uncover specific patterns and opportunities. For example, you might discover that certain pages perform exceptionally well on mobile devices but underperform on desktop.
How to Check Web Traffic & Website Performance Report
To get the most out of your Performance report:
- Look beyond the default 3-month view: Extend your date range to identify seasonal patterns or long-term trends
- Compare periods: Use the comparison feature to see how your performance has changed over time
- Segment your data: Filter by country, device, or search type to identify specific opportunities
- Export your data: Download your Performance data to Excel or Google Sheets for deeper analysis or to combine it with other data sources
For more advanced analysis, you can use the GSC API to programmatically access your performance data:
from googleapiclient.discovery import build

service = build('webmasters', 'v3', credentials=credentials)
response = service.searchanalytics().query(
    siteUrl='https://example.com',
    body={
        'startDate': '2023-01-01',
        'endDate': '2023-01-31',
        'dimensions': ['query', 'page'],
        'rowLimit': 1000
    }
).execute()
For more advanced insights, Moz recommends connecting GSC with Google Analytics through the Integration settings in Analytics. This combination gives you a complete view of your users’ journey from search to site interaction.
Using the Performance Report for SEO Improvements
The real value of the Performance report comes from turning data into action. Here are practical ways to leverage these insights:
- Identify declining queries: Look for previously successful keywords that are losing position or clicks, then refresh the corresponding content
- Discover new opportunities: Find queries where you rank on page two (positions 11-20) and optimize those pages to push them onto page one
- Improve underperforming content: Target pages with high impressions but low CTR by enhancing titles and meta descriptions
- Spot seasonal trends: Prepare content updates before predictable seasonal spikes in certain queries
At a technical level, you can also:
- Use regex patterns to analyze groups of related queries:
query contains:productto see all queries containing “product”query:^buyto see queries that start with “buy”query:shoes$to see queries that end with “shoes”
- Create custom dimensions in Google Analytics to segment organic traffic by query intent:
// Example GA4 event for capturing GSC query data gtag('event', 'page_view', { 'query_intent': 'transactional', 'search_position': 3 });
As Botify explains, “The Performance report isn’t just about measuring current success—it’s about identifying opportunities for future growth.”
Advanced Insights: Backlinks & Beyond
Once you’re comfortable with the basics of GSC, it’s time to explore some of its more advanced features and insights.
6.1 Backlinks Search Console: Analysing Link Data
The Links report in GSC provides valuable insights into your site’s backlink profile, showing you:
- Which external sites link to your content most frequently
- Your most linked content
- The anchor text other sites use when linking to you
According to Ahrefs’ link building guide, this information helps you identify your most valuable content (from a linking perspective) and uncover potential relationship-building opportunities with sites that already link to you.
From a technical standpoint, GSC’s backlink data differs from third-party tools in several important ways:
- It pulls directly from Google’s index, showing links that Google has actually discovered
- It doesn’t assign metrics like Domain Authority or URL Rating to linking domains
- It doesn’t distinguish between dofollow and nofollow links in the main interface
- It samples data for sites with large numbers of backlinks
For programmatic access to your link data, you can use the GSC API’s siteLinks.list() method:
links = service.siteLinks().list(
    siteUrl='https://example.com',
    linkStatus='LIVE'
).execute()
While GSC doesn’t provide as comprehensive backlink data as dedicated tools like Ahrefs or Majestic, it offers the advantage of showing you exactly what Google knows about your link profile.
Combining GSC and “Google Website Ranking” Reports
For a more complete picture of your search performance, consider combining GSC data with third-party rank tracking tools. While GSC shows your average position, dedicated ranking tools can track specific keywords day by day and monitor competitor rankings.
BrightEdge research shows that combining these data sources helps you:
- Validate rank tracking data against Google’s own metrics
- Identify discrepancies that might indicate tracking issues
- Discover new keyword opportunities not covered by your tracking tools
- Understand how algorithm updates affect both your rankings and user behavior
At a technical level, you can create custom dashboards that pull data from both sources:
- Export GSC data using the API or manual download
- Export ranking data from your tracking tool
- Create a unified spreadsheet or dashboard using tools like Google Data Studio
- Set up automated reporting with scheduled refreshes
This integrated approach gives you both the accuracy of Google’s first-party data and the competitive insights of third-party tools.
Low-Hanging Fruit: Leveraging Metrics Results for Quick Wins
One of the most effective strategies for improving search performance is to focus on “low-hanging fruit” – opportunities that require minimal effort but yield significant results.
In GSC, these opportunities often appear as:
- Position improvers: Queries where you’ve recently gained ranking position but haven’t seen a corresponding increase in clicks
- Page two rankings: Queries where you rank between positions 11-20, just missing the first page
- High impression, low CTR pages: Content that appears often in search results but doesn’t attract clicks
From a technical implementation standpoint, you can identify these opportunities with SQL-like queries against your exported GSC data:
-- Find page 2 rankings with high impressions
SELECT query, page, impressions, position
FROM gsc_data
WHERE position BETWEEN 11 AND 20
AND impressions > 100
ORDER BY impressions DESC
Search Engine Journal’s optimization guide suggests focusing first on these opportunities, as even small improvements to titles, meta descriptions, or content can dramatically improve your visibility and traffic.
Google Search Console Course & Tutorials for Ongoing Learning
GSC regularly adds new features and reports, making continuous learning essential. Fortunately, there are excellent resources available to help you stay current:
- Google’s own GSC training provides official tutorials and best practices
- Moz’s Google Search Console training offers in-depth lessons on leveraging each report
- SEMrush Academy provides free courses on maximizing your GSC insights
For more technical users, resources like Codelabs offer hands-on practice with the GSC API and advanced data analysis techniques:
// Example of using the Search Console API with Node.js
const {google} = require('googleapis');
const searchconsole = google.searchconsole('v1');

async function getSearchAnalytics() {
  const auth = new google.auth.GoogleAuth({
    scopes: ['https://www.googleapis.com/auth/webmasters']
  });
  const client = await auth.getClient();

  const result = await searchconsole.searchanalytics.query({
    auth: client,
    siteUrl: 'https://example.com',
    requestBody: {
      startDate: '2023-01-01',
      endDate: '2023-01-31',
      dimensions: ['query'],
      rowLimit: 1000
    }
  });

  return result.data;
}
As Backlinko recommends, setting aside time each month to explore new GSC features and reports ensures you’re always getting maximum value from this powerful tool.
Troubleshooting Common Issues
Even experienced webmasters encounter challenges with their websites. GSC helps identify and resolve these issues before they significantly impact your search performance.
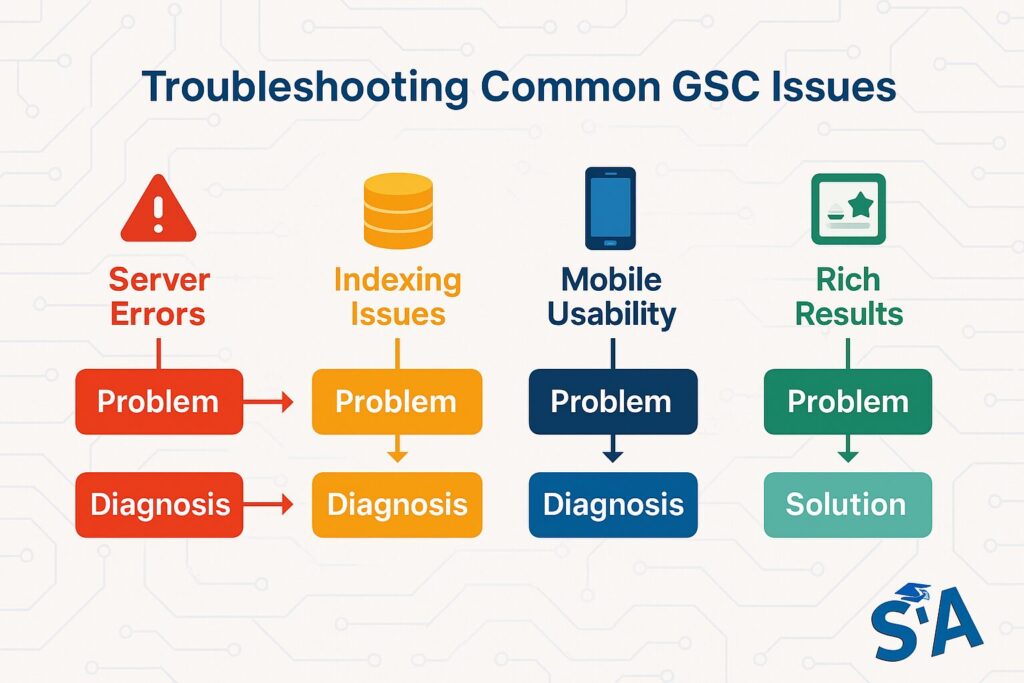
Handling Index Coverage Errors
When GSC flags index coverage errors, addressing them promptly can prevent ranking losses. According to Google’s troubleshooting documentation, the most common issues include:
- Server errors (5xx): Often caused by resource limitations, misconfigured .htaccess files, or problematic plugins
- 404 errors: Pages that no longer exist but are still linked internally or externally
- Robots.txt errors: Configurations that unintentionally block important content
At a technical level, diagnosing server errors often requires checking your server logs for specific error codes and timestamps. For example, on Apache servers:
grep "HTTP/1.1\" 500" /var/log/apache2/error.log | tail -n 20For robots.txt issues, you can test your configuration directly in GSC’s robots.txt Tester, which shows exactly how Googlebot interprets your directives:
User-agent: Googlebot
Disallow: /admin/
Allow: /admin/public-files/
For canonical issues, ensure your implementation follows best practices:
<!-- Self-referential canonical on the canonical version -->
<link rel="canonical" href="https://example.com/product/" />

<!-- Canonical pointing to the preferred version on duplicate pages -->
<link rel="canonical" href="https://example.com/product/" />
For mobile-specific issues, Mobile Moxie’s guide offers specialized solutions to ensure your site performs well on all devices.
Diagnosing Performance Drops and Recovering Rankings
Sudden drops in clicks or impressions can be alarming, but GSC provides tools to diagnose and address these changes. When performance decreases:
- Check for algorithm updates: Compare your drop dates against known Google updates using resources like Search Engine Journal’s update history
- Look for technical issues: Review the Index Coverage report for new errors
- Analyze query changes: See if specific queries have declined or if the drop affects all keywords
- Consider seasonality: Determine if the same pattern occurred in previous years
For more technical diagnosis, you can:
- Compare server logs with GSC crawl stats to identify changes in crawling patterns
- Look for changes in rendered HTML using the URL Inspection tool’s “View Crawled Page” feature
- Check for changes in page speed metrics in the Core Web Vitals report
- Review your site’s structured data implementation for errors or warnings
If the issue appears related to a specific update, you might need to adjust your content strategy:
<!-- Example of implementing FAQ schema to recover from an update targeting informational content -->
<script type="application/ld+json">
{
  "@context": "https://schema.org",
  "@type": "FAQPage",
  "mainEntity": [{
    "@type": "Question",
    "name": "What is Google Search Console?",
    "acceptedAnswer": {
      "@type": "Answer",
      "text": "Google Search Console is a free service that helps you monitor and troubleshoot your site's presence in Google Search results."
    }
  }]
}
</script>
As SEO Powersuite explains, distinguishing between algorithm updates, technical issues, and normal fluctuations helps you implement the right recovery strategy.
Integrating GSC with Other Tools (e.g., Google Analytics, AdWords)
GSC becomes even more powerful when integrated with other marketing tools:
- Google Analytics integration provides a complete picture of how users find and interact with your site. The integration happens at the property level in Google Analytics:
Admin > Property Settings > Search Console > Adjust Search ConsoleThis allows you to see GSC data directly in Analytics reports and segment organic traffic by query. Analytics Mania offers a setup guide for combining these powerful platforms. - Google Ads connection helps you understand how organic and paid search efforts complement each other. To connect your accounts:
Google Ads > Tools > Linked accounts > Search Console > LinkAccording to WordStream’s research, this integration can identify keywords that perform well organically but might benefit from paid support during competitive seasons. - Data Studio dashboards can transform raw GSC data into actionable visualizations. The API connection uses:
Add data > Connectors > Search ConsoleGoogle’s Data Studio gallery offers templates specifically designed for Search Console reporting.
For programmatic integration, you can use the GSC API along with other Google APIs:
# Example of combining Analytics and Search Console data
from googleapiclient.discovery import build

# Initialize the Analytics and Search Console services
analytics = build('analyticsreporting', 'v4', credentials=credentials)
searchconsole = build('webmasters', 'v3', credentials=credentials)

# Get organic landing page data from Analytics
analytics_response = analytics.reports().batchGet(
    body={
        'reportRequests': [{
            'viewId': 'XXXX',
            'dateRanges': [{'startDate': '7daysAgo', 'endDate': 'today'}],
            'metrics': [{'expression': 'ga:sessions'}],
            'dimensions': [{'name': 'ga:landingPagePath'}],
            'dimensionFilterClauses': [{
                'filters': [{
                    'dimensionName': 'ga:medium',
                    'operator': 'EXACT',
                    'expressions': ['organic']
                }]
            }]
        }]
    }
).execute()

# Get page performance data from Search Console
search_response = searchconsole.searchanalytics().query(
    siteUrl='https://example.com',
    body={
        'startDate': '7daysAgo',
        'endDate': 'today',
        'dimensions': ['page'],
        'rowLimit': 1000
    }
).execute()
These integrations help you break down data silos and develop more comprehensive digital strategies.
Monitoring the Google Search Console Logo & Branding Updates
While GSC interface updates might seem minor, they often accompany significant feature changes. Google periodically refreshes the Search Console design and functionality, as documented by Search Engine Roundtable.
Staying alert to these changes ensures you’re leveraging the full power of GSC. Recent years have seen major additions like:
- Core Web Vitals reporting for performance monitoring
- Regular Expression support in Performance filtering
- Enhanced mobile usability insights
- Improved Schema markup validation
From a technical standpoint, these updates sometimes require adjustments to your reporting workflows, especially if you’re using the API or custom dashboards. The GSC API is versioned (currently v3 for most endpoints), but new features sometimes require migrating to newer endpoints:
# Legacy Search Analytics API (v3)
service = build('webmasters', 'v3', credentials=credentials)
response = service.searchanalytics().query(...)

# Newer Search Console API features
service = build('searchconsole', 'v1', credentials=credentials)
response = service.urlInspection().index().inspect(...)
Following official Google channels and reputable SEO news sources helps you quickly adapt to these evolving capabilities.
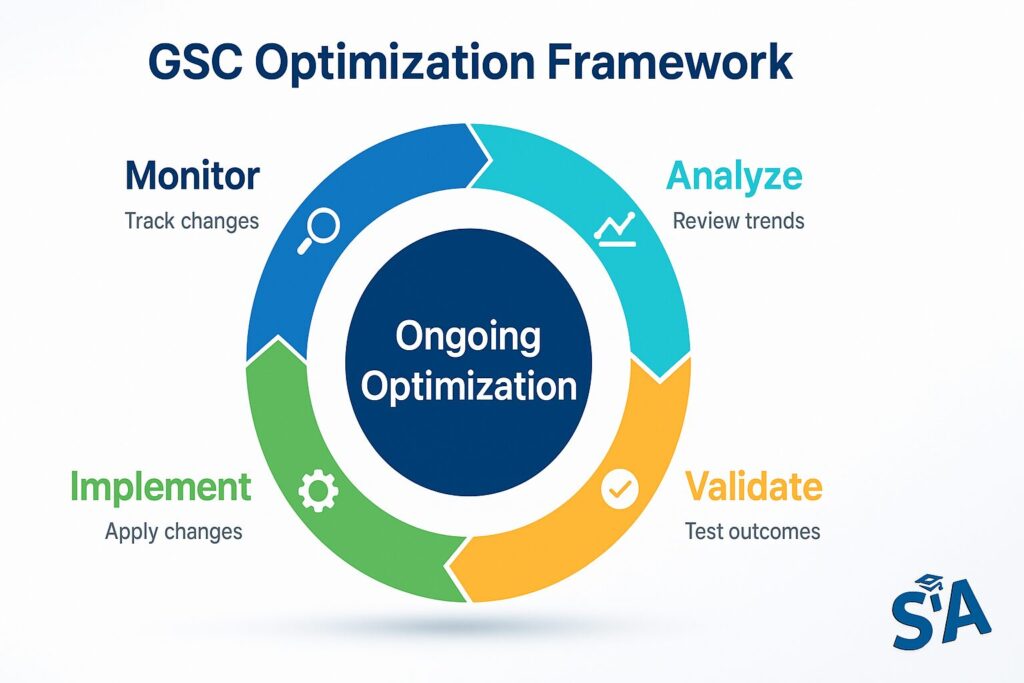
Optimisation & Best Practices
To maximize the value of Google Search Console, implement these proven optimization strategies and best practices.
How to Use Search Console Data to Boost SEO
GSC provides actionable data that can directly improve your search visibility:
- Optimize underperforming content: Use the Performance report to identify pages with low CTR or declining rankings, then refresh them with updated information and improved headlines.
- Create content based on query data: As Content Marketing Institute advises, review queries where you appear in search results but don’t have dedicated content addressing those specific topics.
- Fix technical issues proactively: Schedule regular reviews of your Index Coverage report to catch potential problems before they impact your rankings.
- Improve Core Web Vitals: Use the Page Experience report to identify and fix loading speed, interactivity, and visual stability issues that affect user experience and rankings.
From a technical implementation standpoint, consider:
- Developing automated scripts to alert you when key metrics change significantly:
# Simple script to alert on significant CTR drops
import pandas as pd
from datetime import datetime, timedelta

# Load your GSC data
current_data = pd.read_csv('gsc_current.csv')
previous_data = pd.read_csv('gsc_previous.csv')

# Merge datasets
merged_data = current_data.merge(
    previous_data,
    on='page',
    suffixes=('_current', '_previous')
)

# Calculate CTR changes
merged_data['ctr_change'] = merged_data['ctr_current'] - merged_data['ctr_previous']

# Alert on significant drops
significant_drops = merged_data[merged_data['ctr_change'] < -0.05]
if not significant_drops.empty:
    print("Pages with significant CTR drops:")
print(significant_drops[['page', 'ctr_change']])- Implementing structured data for improved rich results, using JSON-LD format:
<script type="application/ld+json">
{
  "@context": "https://schema.org",
  "@type": "Article",
  "headline": "Search Console 101: A Walkthrough",
  "author": {
    "@type": "Person",
    "name": "Jane Smith"
  },
  "datePublished": "2023-06-15T08:00:00+08:00",
  "dateModified": "2023-06-16T09:20:00+08:00"
}
</script>
The key is establishing a systematic process for reviewing and acting on GSC data, rather than only checking it sporadically.
Setting Up a Website Performance Report Schedule
Consistent monitoring helps you identify trends, catch issues early, and measure the impact of your optimization efforts. Databox research suggests implementing a tiered monitoring schedule:
- Weekly checks: Review top-level performance metrics and any critical errors
- Monthly deep dives: Analyze query and page performance trends, check indexing status, and identify optimization opportunities
- Quarterly comprehensive reviews: Evaluate long-term trends, compare against goals, and adjust your SEO strategy accordingly
For technical implementation, consider automating your reporting process:
- Use Google Data Studio for visualizing trends with automatic updates
- Schedule API pulls to download fresh GSC data to your own systems
- Set up email notifications for critical alerts:
# Example of automated GSC reporting with email notifications
import pandas as pd
import smtplib
from email.mime.multipart import MIMEMultipart
from email.mime.text import MIMEText
from googleapiclient.discovery import build

# Get data from GSC API
service = build('webmasters', 'v3', credentials=credentials)
response = service.searchanalytics().query(
    siteUrl='https://example.com',
    body={
        'startDate': '30daysAgo',
        'endDate': 'today',
        'dimensions': ['query'],
        'rowLimit': 100
    }
).execute()

# Transform into DataFrame
data = []
for row in response['rows']:
    data.append({
        'query': row['keys'][0],
        'clicks': row['clicks'],
        'impressions': row['impressions'],
        'ctr': row['ctr'],
        'position': row['position']
    })
df = pd.DataFrame(data)

# Create email report
msg = MIMEMultipart()
msg['Subject'] = 'Monthly GSC Performance Report'
msg['From'] = 'your-email@example.com'
msg['To'] = 'recipient@example.com'

# Add report content
html = f"""
<h1>GSC Monthly Report</h1>
<p>Total clicks: {df['clicks'].sum()}</p>
<p>Top queries by clicks:</p>
<table>
    {df.sort_values('clicks', ascending=False).head(10).to_html()}
</table>
"""
msg.attach(MIMEText(html, 'html'))

# Send email
server = smtplib.SMTP('smtp.example.com', 587)
server.starttls()
server.login('username', 'password')
server.send_message(msg)
server.quit()
Automating these reviews through email notifications, scheduled exports, or Data Studio dashboards ensures you never miss important changes in your search performance.
Tracking Console Updates & Trends
The search landscape constantly evolves, with Google making thousands of algorithm updates yearly. Staying informed about these changes helps you adapt your strategy proactively:
- Follow official Google channels like the Search Central Blog and Search Liaison Twitter account
- Monitor industry publications like Search Engine Journal, Search Engine Land, and Moz Blog
- Participate in SEO communities where changes are often discussed as they happen
From a technical standpoint, you can also set up monitoring systems to detect algorithm changes that affect your site:
# Simple script to detect potential algorithm updates
import pandas as pd
import numpy as np
from datetime import datetime, timedelta

# Load daily GSC data
df = pd.read_csv('daily_gsc_data.csv', parse_dates=['date'])

# Calculate rolling average and standard deviation
df['rolling_clicks'] = df['clicks'].rolling(window=7).mean()
df['rolling_std'] = df['clicks'].rolling(window=7).std()

# Identify significant deviations (potential updates)
df['z_score'] = (df['clicks'] - df['rolling_clicks']) / df['rolling_std']
significant_changes = df[abs(df['z_score']) > 2].sort_values('date', ascending=False)

if not significant_changes.empty:
    print("Potential algorithm update detected on:")
    print(significant_changes[['date', 'clicks', 'z_score']].head())
As Search Engine Watch notes, keeping pace with GSC updates and search trends ensures you’re always leveraging the latest opportunities to improve your visibility.
Conclusion
Recap of Key Takeaways
Google Search Console has evolved from a technical webmaster tool to an essential resource for anyone serious about improving their online visibility. Through its powerful reports, GSC provides invaluable insights into how Google crawls, indexes, and ranks your content.
The key benefits we’ve explored include:
- Understanding exactly how users find your site through search
- Identifying and fixing technical issues that could impact your rankings
- Discovering new content opportunities based on user queries
- Monitoring your backlink profile and building stronger authority
- Integrating search data with broader analytics for comprehensive insights
From a technical perspective, GSC offers unparalleled access to Google’s own data about your site, including:
- HTTP status codes and rendering information
- Structured data validation and rich result eligibility
- Core Web Vitals metrics at both the URL and origin level
- Mobile usability insights for responsive design optimization
- International targeting information for multi-regional sites
As Neil Patel emphasizes, “GSC is one of the few places where Google actually tells you what they think of your site – ignore this data at your peril.”
Next Steps to Nurture Site SEO with GSC
To continue building on your GSC knowledge:
- Establish a regular review schedule for key reports
- Set up custom alerts for critical issues like coverage errors
- Create a process for validating fixes and measuring their impact
- Integrate GSC data with your content planning workflow
- Continuously educate yourself about new features through Google’s official resources
At a technical level, consider these implementation steps:
- Create a custom dashboard that combines GSC data with other analytics sources
- Set up API access for programmatic monitoring of key metrics
- Implement detailed tracking for your most valuable conversion paths
- Establish a change management process that includes GSC validation
- Develop documentation for your team that standardizes GSC monitoring procedures
Remember that GSC is not just a monitoring tool but a roadmap for improvement. Each data point represents an opportunity to better serve both search engines and your users.
Final Thoughts and Encouragement for Continuous Improvement
The most successful websites aren’t necessarily those with the biggest budgets or the most technical expertise – they’re the ones that consistently learn and adapt based on real data. Google Search Console provides exactly that kind of actionable intelligence, direct from the source.
Whether you’re running a small business website, managing a major e-commerce platform, or building a personal blog, GSC offers insights that can help you connect with your audience more effectively. As Search Engine Land founder Danny Sullivan (now Google’s Search Liaison) puts it: “If you want to understand what’s happening with your site in Google Search, there’s no substitute for Search Console.”
For technically-minded users, GSC represents a unique opportunity to peek behind the curtain of Google’s search algorithms. By monitoring your site’s performance, fixing issues promptly, and continuously optimizing based on search data, you position yourself to succeed regardless of algorithm changes or competitive pressures.